Introduction: Performance is a Full-Stack Problem
In a Rails application, performance bottlenecks can hide anywhere. A slow page might not be a single issue, but a combination of problems spanning the entire stack—from inefficient database queries and slow background jobs to complex view rendering. This case study details a holistic optimization effort on a Rails application, tackling two distinct problems: a long-running data import task and a slow-loading web page.
The results were dramatic: we cut the data import time from nearly a minute to just 18 seconds and slashed the page load time from over 2 seconds to a snappy 156 milliseconds.
Part 1: Optimizing a Slow Data Import Rake Task
The Problem: A Rake task designed to import a large JSON file into the database was taking too long to complete, exceeding our one-minute performance budget.
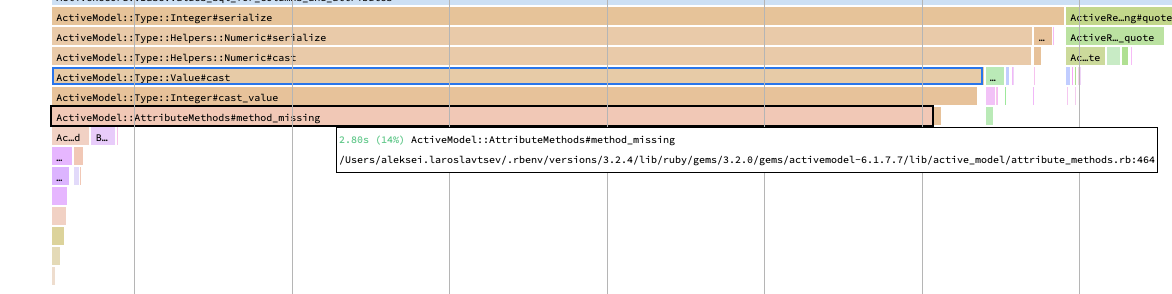
The Investigation: Using profilers like memory-profiler, we analyzed the task. The flame graph immediately pointed to a significant amount of time being spent in ActiveModel::AttributeMethods#method_missing. This is often a symptom of excessive ActiveRecord object instantiation in a tight loop. We also knew that inserting records one by one was causing too many database round-trips.
Solution 1: Switch to Bulk Data Insertion
Instead of creating records one by one, which results in an INSERT statement for every row, we used the activerecord-import gem. This powerful utility allows you to insert thousands of records with a single SQL statement.
Solution 2: Avoid Unnecessary Object Instantiation
The method_missing bottleneck was caused by creating full ActiveRecord objects from our source data just to use their IDs in an association. The fix was to switch to using raw IDs, avoiding the massive overhead of object creation and initialization inside a loop.
The Result: Combining bulk inserts with reduced object allocation cut the import time for our large test file to a mere 18 seconds.
Part 2: Optimizing a Slow Page Load
The Problem: The main page for viewing bus routes was taking over 2,000ms to load, creating a poor user experience.
The Investigation: Using the bullet and rack-mini-profiler gems, we quickly identified the classic Rails performance killer: a series of N+1 queries.
Solution 1: The N+1 Killer - Using includes
The page needed to display a list of trips, along with the bus model for each trip and the services (like Wi-Fi or A/C) available on that bus. The original code was making one query to load the trips, and then for each trip, making another query to fetch its bus, and for each bus, making yet another query to fetch its services. This is an N+1 query storm.
The Fix: The solution is to tell ActiveRecord to load all the necessary associated data upfront using
includes. This single change in the controller reduces hundreds of potential queries to just three.The Code:
# app/controllers/trips_controller.rb

class TripsController < ApplicationController
  def index
    @from = City.find_by_name!(params[:from])
    @to = City.find_by_name!(params[:to])

    # Use includes to preload the bus and its services
    @trips = Trip.includes(bus: :services).where(from: @from, to: @to).order(:start_time)
  end
end
Solution 2: The Database’s Best Friend - Indexing
Even with N+1s fixed, queries can be slow if the database has to perform full table scans. Tools like pghero can identify missing indexes. We found that the foreign key columns used in our queries (from_id, to_id, bus_id) were not indexed.
The Fix: We added a migration to create indexes on these columns. An index acts like a phonebook for your database, allowing it to find the data it needs almost instantly.
The Schema:
# db/schema.rb

create_table "trips", force: :cascade do |t|
  # ... other columns
  t.integer "bus_id"
  # This composite index helps find trips between two cities quickly
  t.index ["from_id", "to_id"], name: "index_trips_on_from_id_and_to_id"
end
(Note: An index on
bus_idwould also be added in a real-world scenario)
Solution 3: Efficient View Rendering
The final bottleneck was in the view itself. Rendering many small, nested partials in a loop can add significant overhead. We refactored the view code into a single, streamlined template, which further reduced the rendering time.
The Result: By layering these three optimizations, the page load time plummeted from over 2000ms to a final, production-ready 156ms.
Conclusion: A Full-Stack Performance Checklist
This case study provides a repeatable checklist for tackling Rails performance issues:
- For Slow Jobs: Use bulk-insertion tools for mass data imports and avoid creating expensive objects in tight loops.
- For Slow Pages: Use
bulletto hunt down and eliminate N+1 queries withincludes. - For Slow Queries: Ensure all foreign key columns and columns used in
WHEREclauses are indexed. - For Slow Renders: Simplify complex views and avoid excessive use of partials in loops.
- Always Profile: Use tools like
rack-mini-profilerandmemory_profilerto get concrete data. Don’t guess.